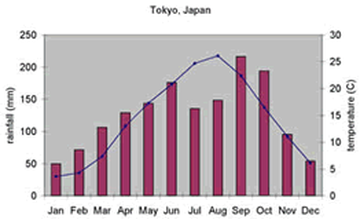
Here is an image showing the climate in Tokyo. As shown, the temperature seems to get the lowest during January, February, November, and December. But the months that has the lowest temperature which was about 6 degrees celsius, was January and December. As for the highest temperatures, they are in June, September and October. But the most highest temperature which is about 26 degrees celsius, is during September.
In this image, it shows that it rains the least during January, February, March, November and December. And the month with the least amount of rain is January, which only has about 30mm of rainfall. This tells us that it rains there less when it is cold. It also shows that the highest rainfall is during May, June, July, August, September and October. This tells us that it mostly rains more when it is hot, and also it rains mostly in the middle of the year. But the month with the very highest rainfall, is August. And in August, the rainfall is about 210 mm.
In this image, it shows that it rains the least during January, February, March, November and December. And the month with the least amount of rain is January, which only has about 30mm of rainfall. This tells us that it rains there less when it is cold. It also shows that the highest rainfall is during May, June, July, August, September and October. This tells us that it mostly rains more when it is hot, and also it rains mostly in the middle of the year. But the month with the very highest rainfall, is August. And in August, the rainfall is about 210 mm.
